You should spend about 20 minutes on this task.
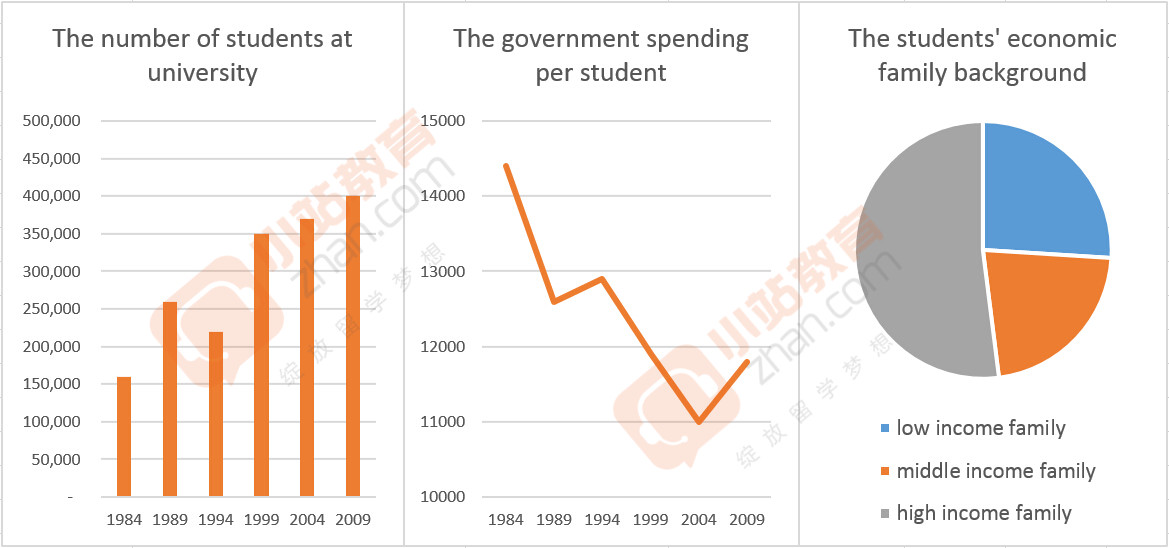
The charts and the pie show the number of students at university in a particular European country, the government's annual spending on each student between 1984 and 2009, and the percentages of students' economic family background.
Write at least 150 words.